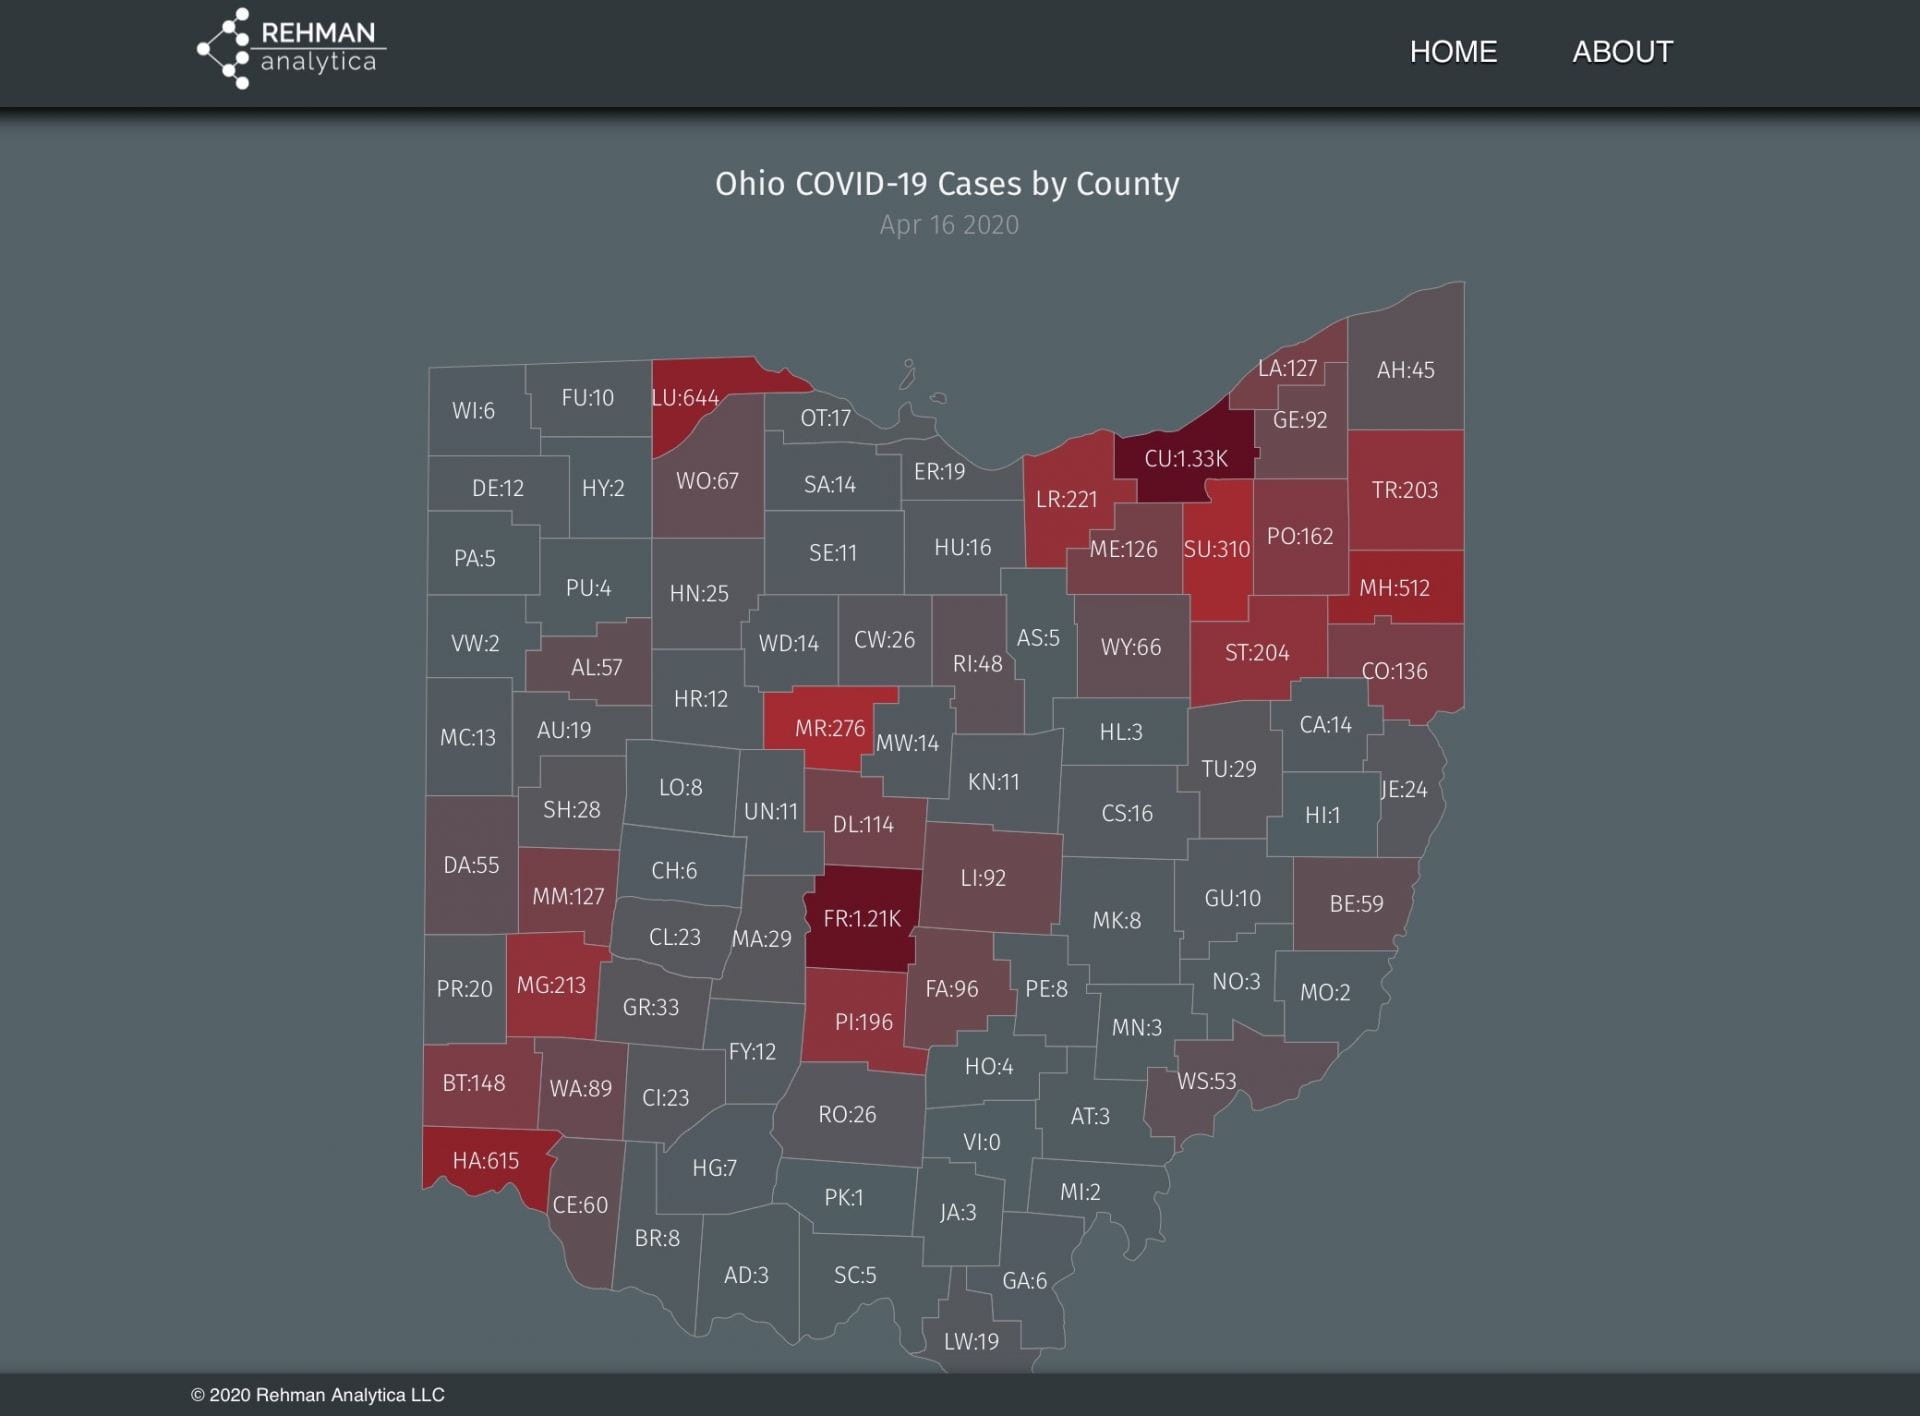
A free online map that tracks the daily COVID-19 cases, deaths and recoveries across Ohio’s 88 counties was created by Faris Rehman, a second-year in computer science and engineering, in hopes to allow people to understand the pandemic at a local level. Credit: Screenshot of Rehman Analytica
Lia Ferguson was not sure how she could help fight the pandemic beyond staying home. Then, she found a team of data-mapping engineers.
A free online map tracking the daily COVID-19 cases, deaths and recoveries across Ohio’s 88 counties was launched March 21 by Faris Rehman, a second-year in computer science and engineering, in hope of allowing people to understand the pandemic at a local level.
“I just hope it eliminates some uncertainty out of people’s lives by giving them the ability to monitor the situation and be in the loop,” Rehman said. “Knowing about what’s in front of you is a lot more comforting than being in the dark about the challenge you’re facing.”
The site is run by Rehman and his team: Ohio State alumni Faisal Baig and Afnan Rehman, Fairs Rehman’s brother, and Ferguson, a third-year in computer science and engineering.
Ferguson said the idea for the map was born during conversations with Rehman about the current global climate.
“We both wanted to help people during this uncertain time in any way that we could, and as computer scientists, we felt like this was something good that we could do,” Ferguson said.
The site started with a map of Ohio, but has since added a map of New York, and includes a chart of total cases, deaths and recoveries for each of the states’ counties. The maps are formed using data from public sources, primarily Johns Hopkins University’s dataset.
Rehman said he began work on the site March 19 and it launched two days later. The team worked around the clock during the site’s creation and continues to spend about 10 hours each day working on the project.
Ferguson said the group collected feedback to ensure they are presenting the data using appropriate styling and scaling.
“If data is presented improperly, your tool can be misleading and actually cause more confusion rather than clarification,” Ferguson said. “Throughout our development process, we have made it a priority to gather feedback from people with all different levels of familiarity with data visualization tools to ensure that our tool is easy to understand and interpret for everyone.”
What began as a way to escape the anxiety and boredom of quarantine has taught Rehman a lot, he said.
“This experience has really driven home the fact that data is king, and sometimes it’s a struggle to get it, particularly in such a rapidly evolving situation,” he said. “Data infrastructure can change very quickly, and you have to be ready to change with it.”
Ferguson said the experience showed her firsthand the potential impact of computer science.
“This is what we’ve been working so hard for at OSU: to be prepared for any opportunity, to use our education and CSE experience to create tools that have a positive impact on society,” Ferguson said.
Though the site is free to visit, Rehman said it accepts donations for hosting fees and paid technologies to improve the site going forward. The team is also looking for more volunteers to help with interface design and publicity.


